At Arizona State University, I lead the Sonoran Visualization Laboratory (SVL). The SVL researches data visualization, human-computer interaction, augmented/virtual reality, and data science. In our group, we develop novel designs, algorithms, statistical models, and techniques to support analysis and decision making for complex data. We regularly collaborate with experts across a range of domains, including medical physicians, sociologists, power systems engineers, genomocists, security experts, and more. Current research projects are sponsored by ASU, Phoenix Children’s Hospital, and NSF.
Several of our current research topics and areas of interest are listed below, though we also work broadly in visualization and machine learning spaces. If you are interested in becoming a collaboratior with the SVL to better understand your data or increase productivity, feel free to email and we can schedule a meeting to discuss further.
Visual Analytics for Complex Data
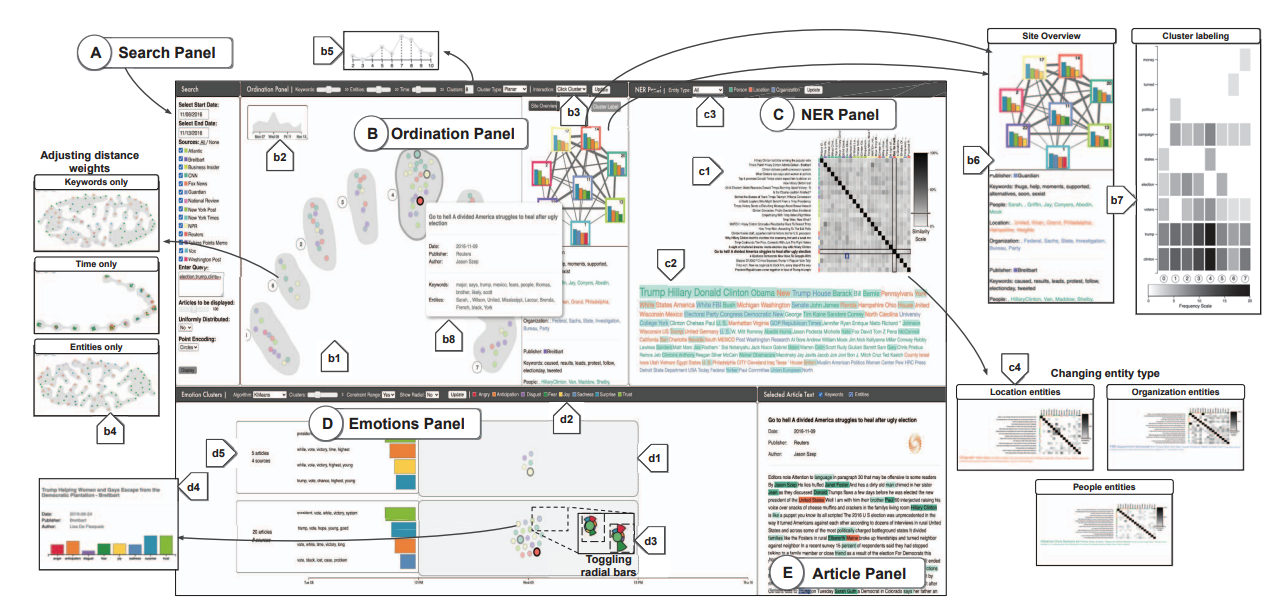
We develop advanced interfaces and visualization techniques to enable new ways to explore complex, high-dimensional, and heterogeneous data. Such data normally cannot be easily handled, accessed, or analyzed using current techniques and tools; we develops software stacks and user experiences that let humans analyze and reason about this data, such as lettting them more deeploy derive insights, support decision-making, and even communicate or tell stories using the data.
Collaborative Visualization
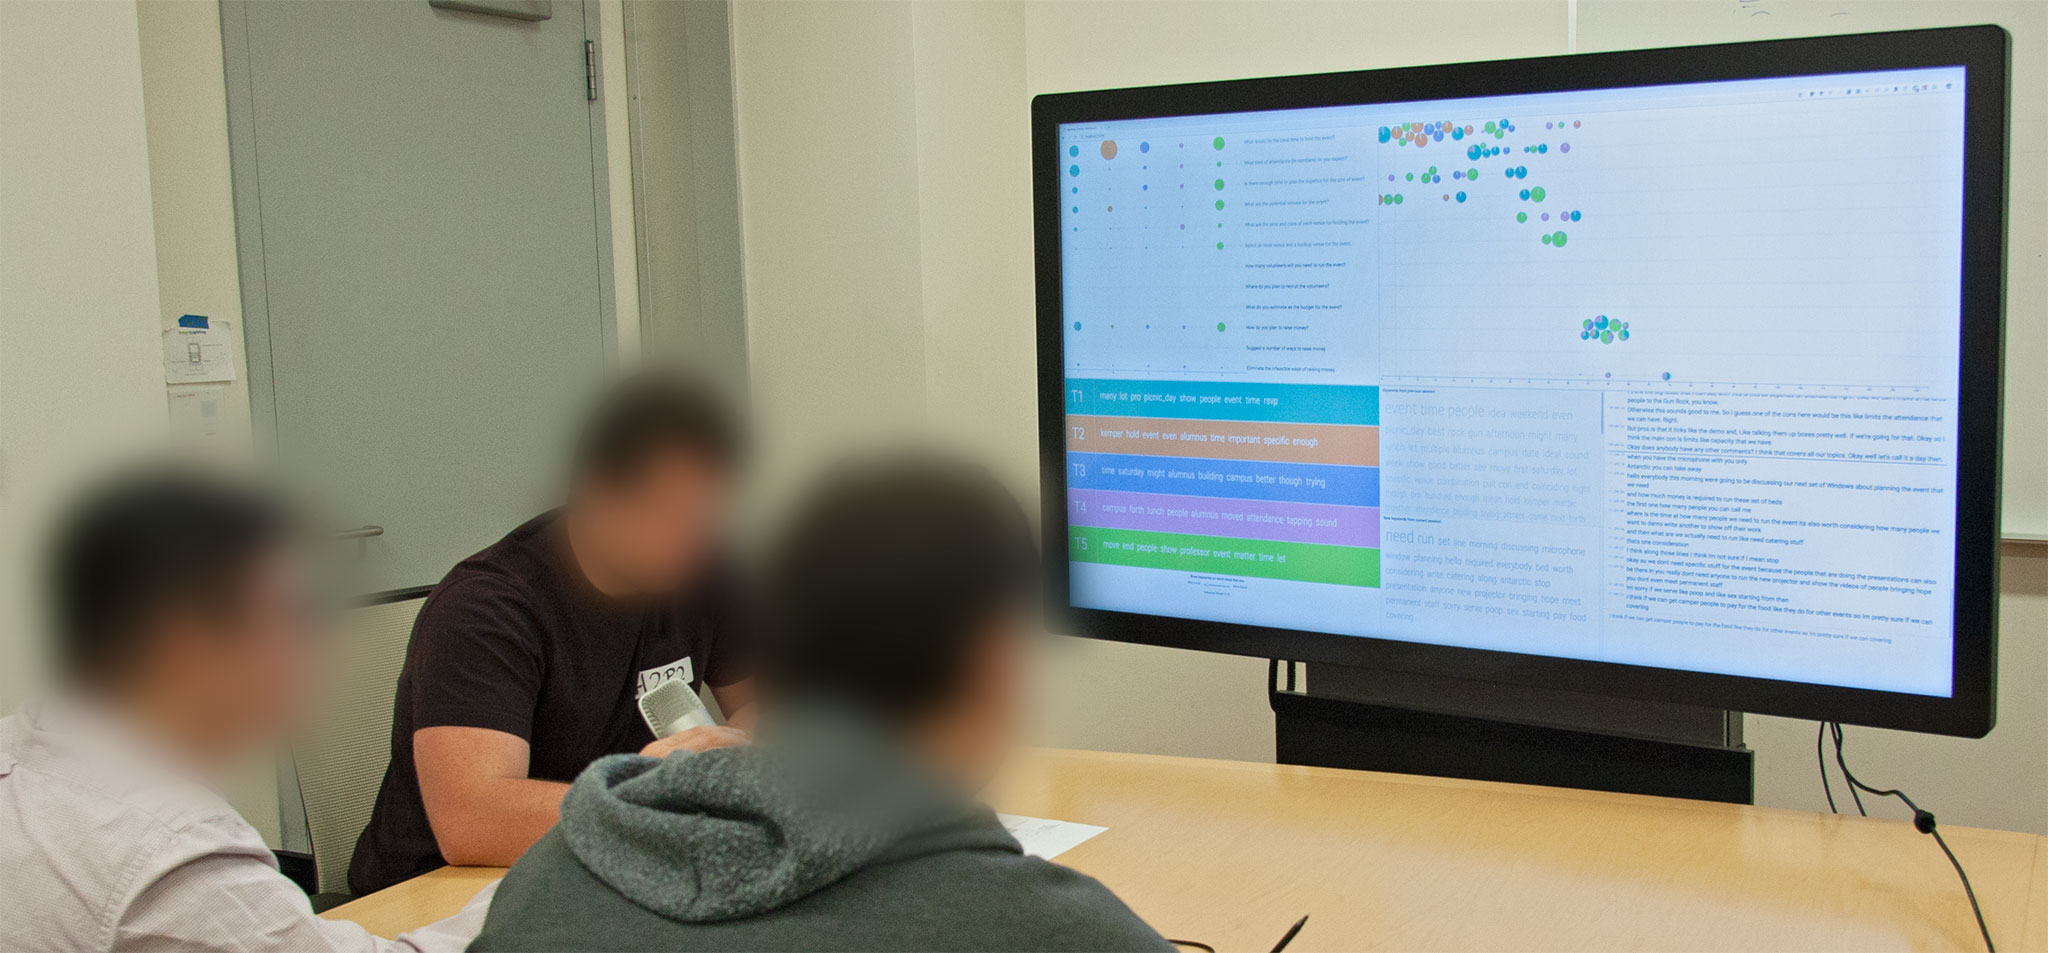
As data scales in size and complexity, it becomes difficult for a single person to fully analyze or comprehend. We develop novel tools to support collaborative visual analysis and sensemaking, including scenarios where multiple users are working together at the same time (synchronous collaboration), where multiple users independently contribute insights to a problem (crowdsourcing), and instances where users complete a set of analysis and then hand off their findings to a user who continues the process (handoff analysis).
Immersive Visualization
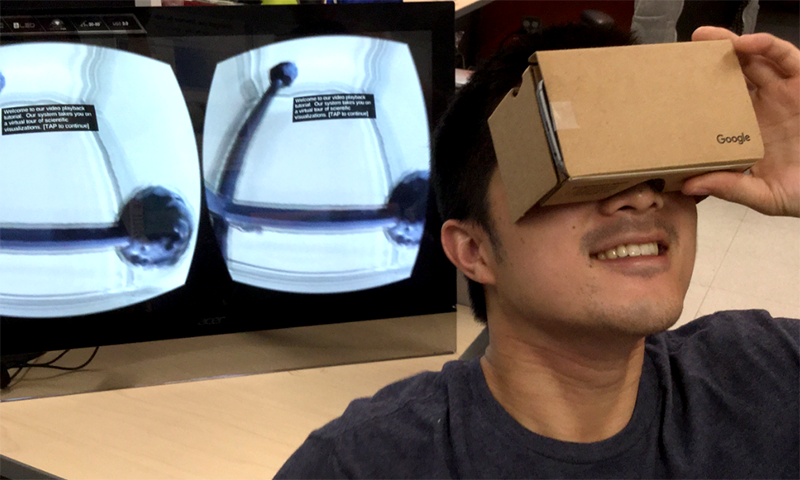
As the technologies for virtual and augmented reality improve, we can exploit such immersive spaces for visualizing and analyzing data. We are developing novel applications and techniques for displaying and analyzing 3D scientific and medical data, and are studying how immersive modalities affect the ways that users interact with such data, and also how they affect collaboration between multiple people. We own several HTC Vive and Microsoft HoloLens 2 devices, allowing us to conduct flexible and robust studies on state-of-the-art hardware.
Privacy-Preserving Visualization
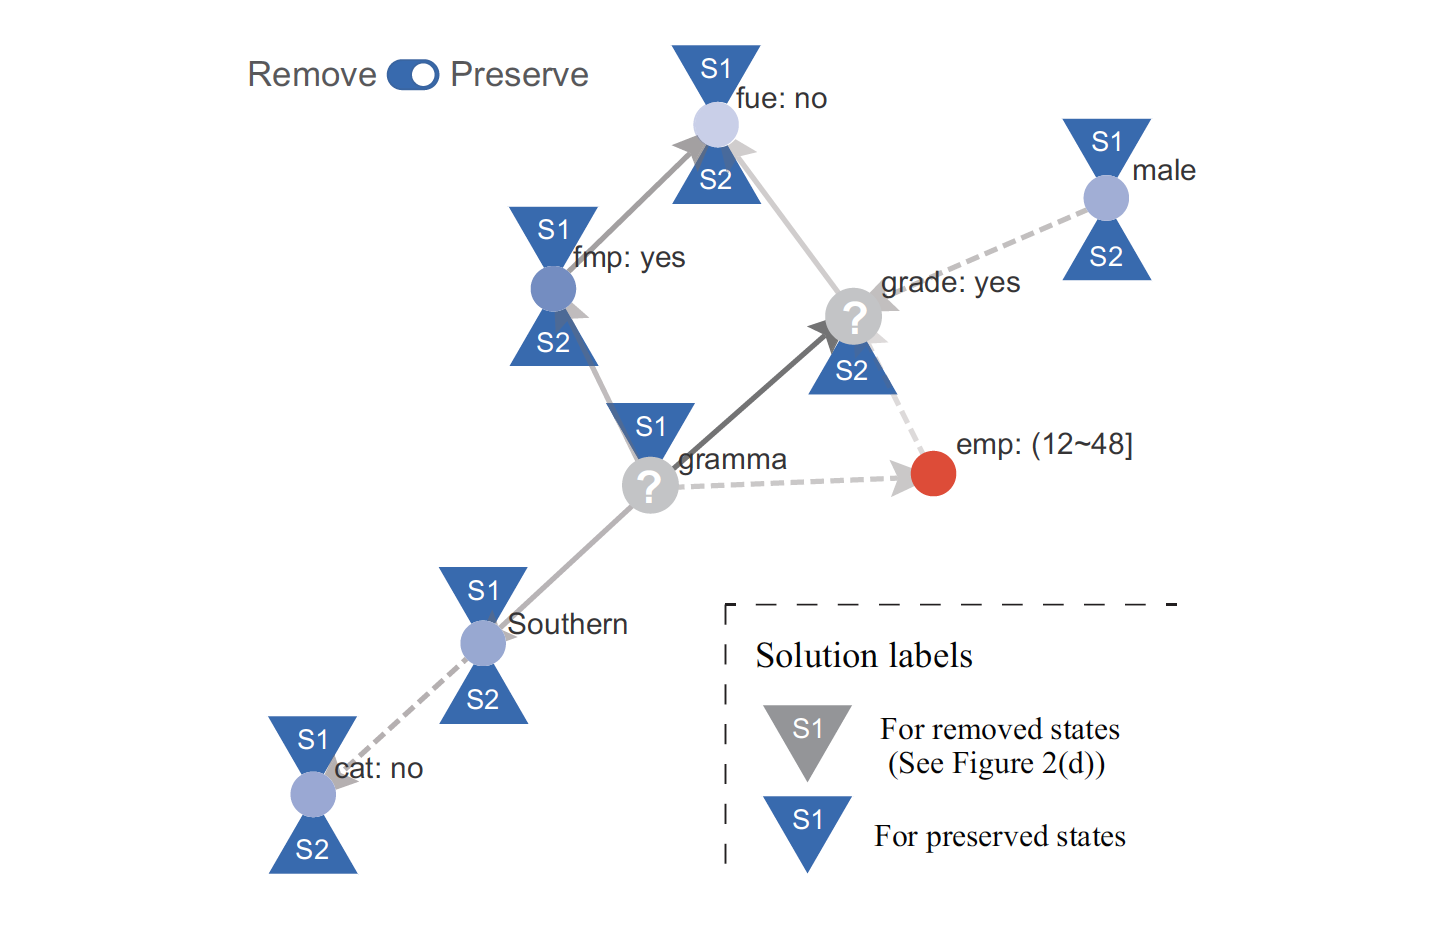
Disclosure of sensitive information is an increasing problem in today's society. We build visual interfaces to help analysts understand how datasets can leak information, and how such data can be sanitized to preserve the privacy of users with minimum overall data loss.
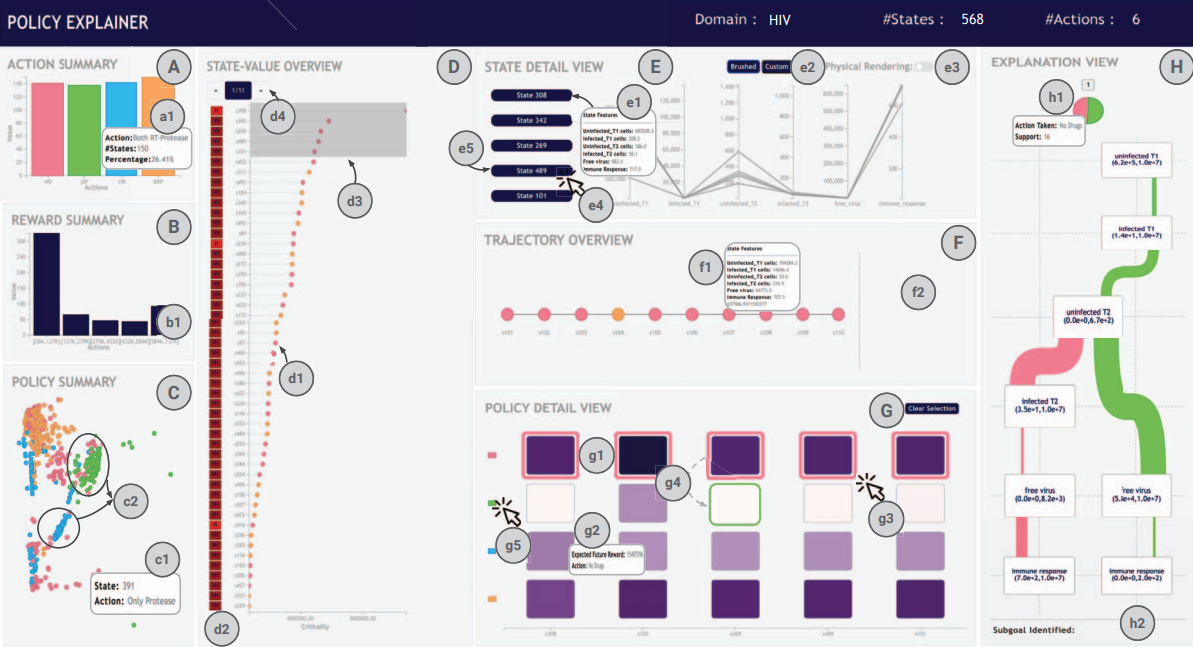
Interfaces for Explainable AI and Human-in-the-Loop ML
We develop interactive visualizations and user interfaces as a way to help understand the behavior of machine learning models. One way to do this is by "opening the black box" to promote trust and interpretability by understanding the inner workings of the model. Conversely, we also develop techniques and tools that support "non-expert" users, who do not necessarily have a background or expertise in AI/ML development. We also study bias and spurious correlations that can exist in datasets that are used to train machine learning models. Conversely, machine learning can be use to help guide the visualization and analysis process, such as selecting appropriate visualizations to show a user during exploration.
Visual Perception and Cognition
We study the low-level cognitive and attentional processes that enable vision and perception, in the context of visualizing data. We also run eye tracking studies using a Tobii X2-60, and conduct large-scale crowdsourced user studies to analyze visualizations.