Chris Bryan
Assistant Professor in Computer Science
School of Computing and Augmented Intelligence
Arizona State University
Head of the Sonoran Visualization Laboratory (SVL @ ASU)
Quick Links
- For researchers and businesses interested in collaborating, see the Research page.
- Are you a student interested in Vis research? Read the Lab Policies page first!
- CV (last updated January 2025)
About
I am an Assistant Professor in the School of Computing and Augmented Intelligence at Arizona State University, which is located in the Ira A. Fulton Schools of Engineering at Arizona State University. I lead the Sonoran Visualization Laboratory (SVL @ ASU). I am also an affiliate faculty with ASU's Global Security Initiative. I received my Ph.D. at the University of California, Davis as a part of the VIDi lab.
My research spans the areas of data visualization, human-computer interaction, augmented and virtual reality, and data science. Broadly, I develop novel algorithms, models, techniques, and interaces that help humans make sense of data. My research group regularly works with complex and real-world data, and develops advanced interactive visual analytics and data pipelines, including exploring advanced data in new ways, modeling and interpreting machine learning and artificial intelligence, and explaining or storytelling with data. See the Research page for more details, and the Publications page for our group's published papers.
External links
- iSearch (my ASU directory profile)
- experts.asu (my ASU expertise database fingerprint)
- Google Scholar
- DBLP
- Twitter (rarely updated...)
- Instagram (even more rarely updated...)
Recent News
September 2025
We have one paper accepted to this year's IEEE VIS conference, by first year PhD student Zhuojun Jiang: The Hue-Man Factor: An Empirical Evaluation of Visualization Perception and Accessibility Across Color Vision Profiles, and three papers, led by recently graduated MS students Shubham Chawla and Utkarsh Singh, accepted to HICSS 2026.
April 2025
We have two papers accepted to this year's EuroVis 2025 conference: Modeling and Measuring the Chart Communication Recall Process and VeCNA: Visual Exploration, Comparison and Analysis of Reconstructed Spatiotemporal Scientific Simulation Data.
We were awarded an Honorable Mention in this year's PacificVis Visual Data Storytelling Contest for our shortlisted entry entitled The Story of Wagyu: Bringing Charm of Japan's Pride to the World (link). 🏆🇯🇵🐄
January 2025
We had two papers accepted this month: (1) PromptAid: Visual Prompt Exploration, Perturbation, Testing and Iteration for Large Language Models has been accepted to IEEE Transactions in Visualization and Computer Graphics. This paper develops a human-in-the-loop pipeline to support iteratively prompting LLMs. (2) Lost in Translation: How Does Bilingualism Shape Reader Preferences for Annotated Charts? has been accepted to CHI 2025. This study explores how presenting annotated text on top of visualizations in different languages (e.g., Arabic and Tamil) impacts reader preferences and cognition for users who are non-native English speakers.
December 2024
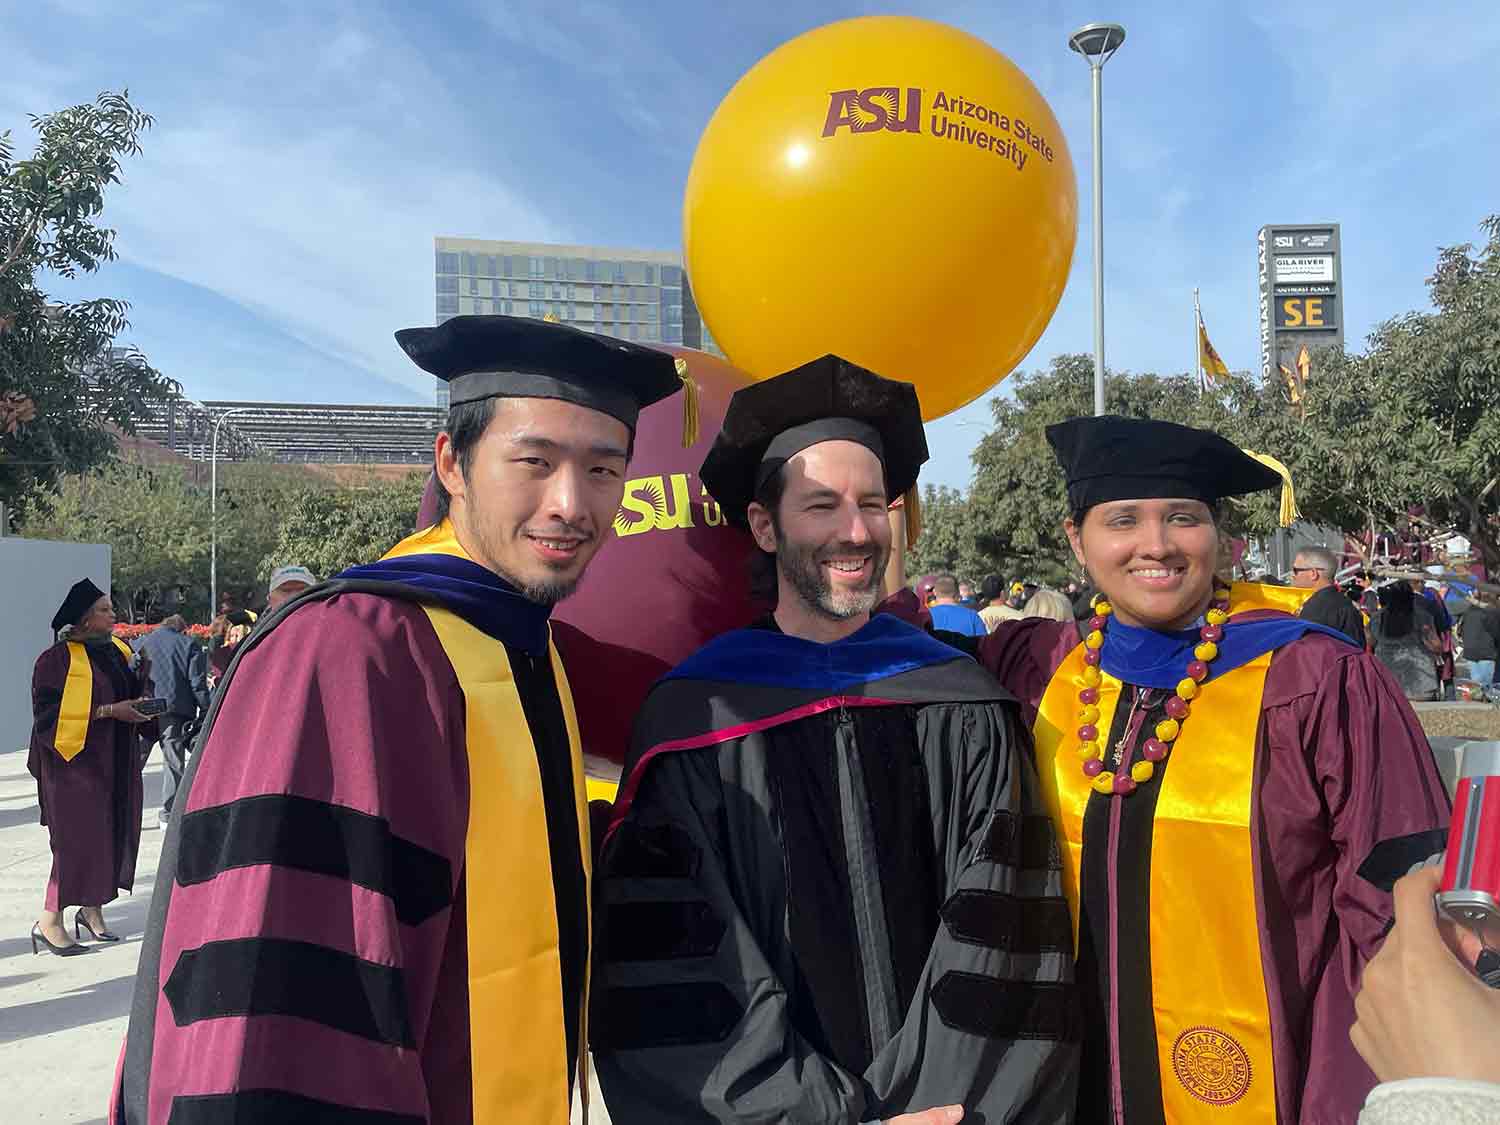
My former students Drs. Jinbin Huang and Anjana Arunkumar walked at the Fall 2024 Convocation (picture). Dr. Arunkumar also received the Dean's Dissertation Award. 🏆 This is the highest honor that can be bestowed on a graduating Ph.D. student in ASU's Fulton Schools of Engineering, and recognizes excellence in research, innovation, and potential for societal impact. Anjana was the only student from SCAI to receive this honor, and it is well deserved based on the fantastic work she did here in the SVL!
September 2024
Huge congratulations to Drs. Aditi Mishra and Jinbin Huang, who both successfully defended their dissertations this month! Dr. Mishra's dissertation, entitled Unlocking Artificial Intelligence: Interactive Visualizations for Novice Users to Explore, Understand, and Trust, and Dr. Huang's dissertation, entitled Understand AI and Go Beyond: Designing Interactive Visual Analytics Systems for Efficient Deep Learning Interpretability and Development, both develop several advanced techniques and tools for interrogating AI models and processes. 👨💻 📊 🧠 Dr. Mishra will soon join Fujitsu Research as a Research Scientist, and Dr. Huang will join Epsilon as a Data Scientist. Congratulations to both of you, and all your hard work in our group!!! 🎉 🎉 🎉
We will have a paper at this year's International Workshop on Data Analysis and Reduction for Big Scientific Data (DRBSD, co-located with Supercoputing 2024). The work, entitled Filling the Void: Data-Driven Machine Learning-Based Reconstruction of Sampled Spatiotemporal Scientific Simulation Data, is based on research Aditi conducted with scientists Los Alamos National Laboratory.
August 2024
Led by my SCAI colleague Rakibul Hasan, I'll be part of an NSF SaTC EDU project to study novel technology-enhanced pedagogies for privacy education: NSF #2350036: Investigating the Role of Storytelling Visualization in Privacy Education (link).
July 2024
We will have two full papers at this year's IEEE VIS conference: Mind Drifts, Data Shifts: Utilizing Mind Wandering to Track the Evolution of User Experience with Data Visualizations, led by recent SVL graduate Anjana Arunkumar, and Defogger: A Visual Analysis Approach for Data Exploration of Sensitive Data Protected by Differential Privacy, conducted in collaboration with Nankai University in Tianjin, China.
I have received a "2024 Top Five Percent Faculty at the Ira A. Fulton Schools of Engineering" award. 🏆
June 2024
Kannak has been awarded a Fulton Schools of Engineering MORE position for the Fall semester. Congrats Kannak! 🥳
May 2024
Anjana successfully defended her dissertation, 🦆 The D.U.C.K. Bridge: Empowering Non-Experts in Data Visualization 🦆. A huge congratulations to Dr. Arunkumar, who will begin a PostDoc at Northeastern University this summer! 🥳 🥳 🥳
August 2023
Michael's paper Comparing Collaborative Visualization Behaviors in Desktop and Augmented Reality Environments has been accepted to ACM VRST 2023. We explored how two-person teams (aka, dyads) communicate and interact when using Hololenses to analyze 3D visualizations in augmented reality.
July 2023
Anjana's paper Image or Information? Examining the Nature and Impact of Visualization Perceptual Classification has been accepted to IEEE VIS 2023. This project explores how we cognitively internalize data visualizations: as images, or as information? We created a dataset of 500 annotated visualizations and then conducted a pair of large-scale experiments to investigate the nature of such internalization and explore how memory encoding affects it retrieval. This work was done in collaboration with fellow ASU professor Gi-Yeul Bae and Northeastern professor Lace Padilla.
June 2023
Congrats to Anjana, Aditi, and Jinbin on passing their comprehensive exams and dissertation proposals this spring! 🎉 🎉 🎉 Lots of good work going on in the SVL right now!
I have received a "2023 Top Five Percent Faculty at the Ira A. Fulton Schools of Engineering" award. 🏆
April 2023
Anjana and Shubham's paper LINGO: Visually Debiasing Natural Language Instructions to Support Task Diversity has been accepted to EuroVis 2023! LINGO is a novel visual analytics interface that supports an effective, task-driven workflow to help identify bias in natural language task instructions, alter (or create) task instructions to reduce bias, and evaluate pre-trained model performance on debiased task instructions.
February 2023
Anjana's paper Real-Time Visual Feedback to Guide Benchmark Creation: A Human-and-Metric-in-the-Loop Workflow has been accepted to EACL 2023! This paper introduces an pair of human-in-the-loop techniques/interfaces supporting an analyst moderating crowdworker responses for benchmark dataset creation tasks.
December 2022
I have joined the Steering Committee for the IEEE Symposium on Visualization for Cyber Security (VizSec). 🔐 📊 ⚖️
Jose and Shubham both passed their M.S. defenses and submitted their theses. Congrats guys! 🎉 🎉 🎉
October 2022
I have been awarded an NSF SaTC grant to explore methods for creating "privacy-aware visualizations." NSF #2224066: Effective Design and Recommendation for Privacy-Preserving Data Visualizations (link).
September 2022
A paper by SVL student Jinbin Huang has been accepted to the Visual Analytics in Immersive Environments (VAinIE) Workshop at ISMAR 2022. SPARVIS: Combining Smartphone and Augmented Reality for Visual Data Analytics develops a framework and demo tool that uses a smartphone as an input and interaction device when visualizing data in augmented reality headsets.
August 2022
We have two full papers accepted to this year's IEEE VIS conference. ConceptExplainer: Understanding the Mental Model of Deep Learning Algorithms via Interactive Concept-based Explanations, led by Jinbin Huang, is a visual analytics sytem for non-expert AI users to explore the behavior of image classification models using concept-based explanations. PMU Tracker: A Visualization Platform for Egocentric Event Propagation Analysis in the Power Grid, led by Anjana Arunkumar, develops a novel dendrogram-based visualization technique for analyzing topological network data.
July 2022
Here is an article about a pilot project (called Space Activity Heat Map) that we'll be working on over the next year with ASU's Interplanetary Initiative. 🚀 🪐 🛰
June 2022
We are very excited to be awarded an NSF IUSE grant to investigate ways to improve visualiation education: NSF #2216452: Developing and Evaluating a Classroom Orchestration Toolkit for Visualization Education (link).
April 2022
Our paper PMUVis: A Large Scale Platform to Assist Power System Operators in a Smart Grid has been published in IEEE Computer Graphics & Applications (link), led by SVL researcher Anjana Arunkumar. We worked with power grid engineers to design a visualization interface supporting the analysis of synchrophasar data.
March 2022
SVL researcher Aditi Mishra was awarded a SCAI Doctoral Fellowship, in recognition of her excellent work as an ASU graduate student. 🎉 Congrats, Aditi! 🎉
February 2022
We have two papers that have been accepted into this year's IEEE PacificVis, both led by SVL researcher Aditi Mishra: News Kaleidoscope: Visual Investigation of Coverage Diversity in News Event Reporting, and Why? Why not? When? Visual Explanations of Agent Behaviour in Reinforcement Learning.
January 2022
I will be the general chair for this year's IEEE Symposium on Visualization for Cyber Security (https://vizsec.org/vizsec2022/), co-located with the IEEE VIS 2022 conference.
September 2021
Our paper ChartStory: Automated Partitioning, Layout, and Captioning of Charts into Comic-Style Narratives has been published in IEEE Transactions on Visualization and Computer Graphics (link)!
August 2021
We have two papers that will be presented at this year's IEEE VIS conference. Bayesian Modelling of Alluvial Diagram Complexity is a VIS short paper based on Shashank Ginjpalli's Barrett thesis, and Phoenix Virtual Heart: A Hybrid VR-Desktop Visualization System for Cardiac Surgery Planning and Education, led by Jinbin Huang, in a collaboration with several medical researchers and clinicians at Phoenix Children's Hospital, will be presented at the co-located IEEE Workshop on Visual Analytics in Healthcare (VAHC).
February 2021
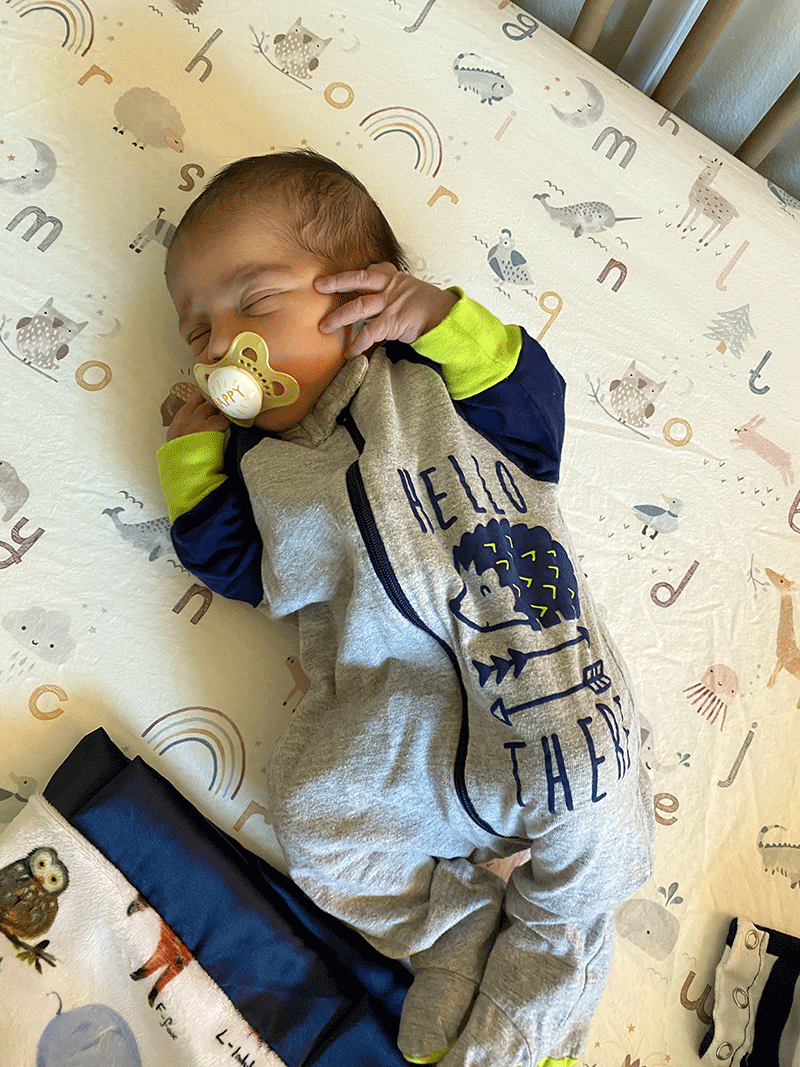
Excited to welcome the newest research assistant to the SVL @ ASU! 👶🏼 🍼

